ProfiSight network visualization software

This page keeps all original information and links. Japanese page

Profitap → Full duplex tap C1P-1G Profishark 1G ProfiShark 1G Plus ProfiShark 10G ProfiShark 10G Plus capture appliance IOTA IOTA traffic management screen IOTA 1G+ IOTA10G+ BiDi compatible PON TAP network packet broker 1-100G Fiber TAP 10G Cupper TAP 10/40G Bypass TAP Regeneration TAP Replication TAP Aggregation TAP
ProfiSight

Profitap Profisight
Network analysis solution End of sale/support

Dutch Profitap official distributor
Ikeriri sells, supports, and maintains the ProfiShark series of Profitap in the Netherlands. Not only can we offer low agent prices, but we also provide maintenance and support based on our extensive wireless LAN-related technology. Please give me inquiry(→Online) ! !
ProfiSight

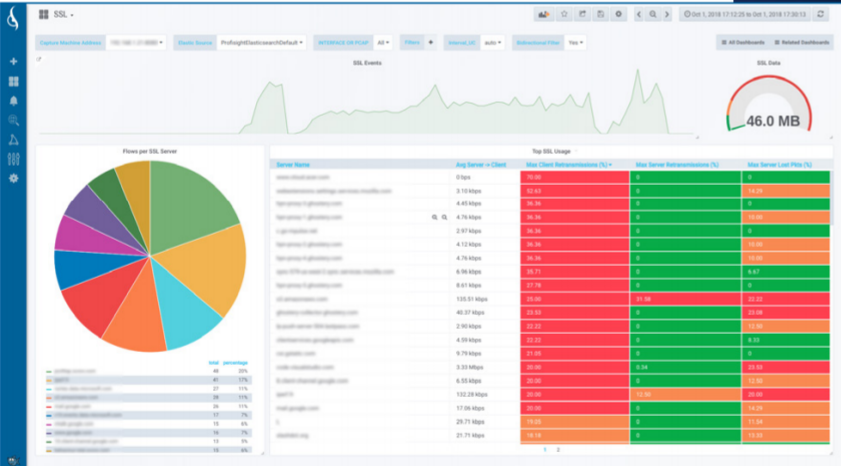
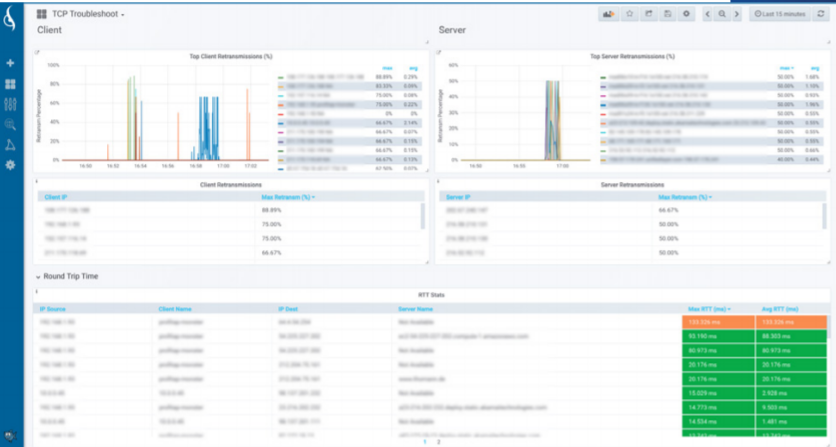
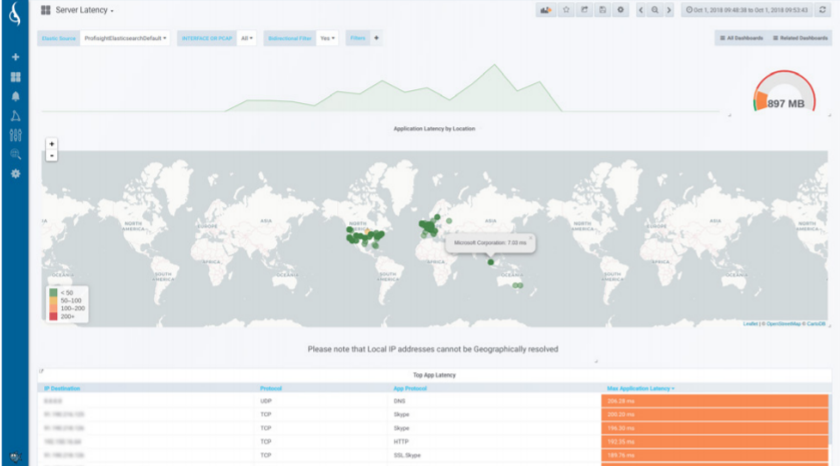
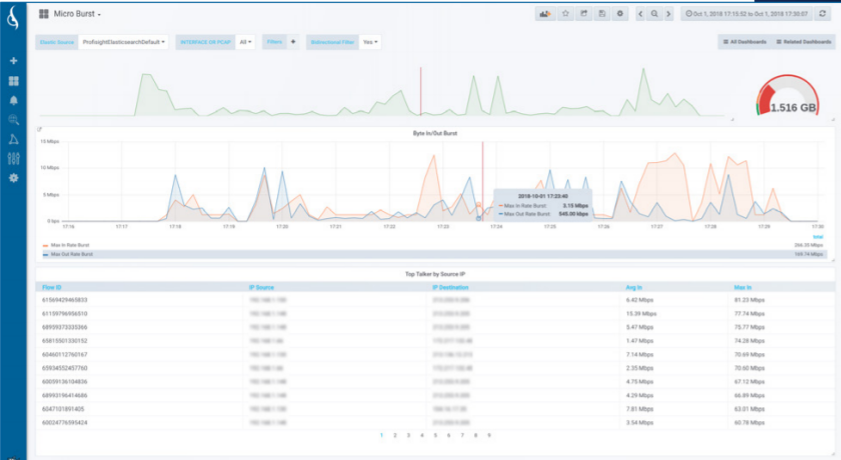
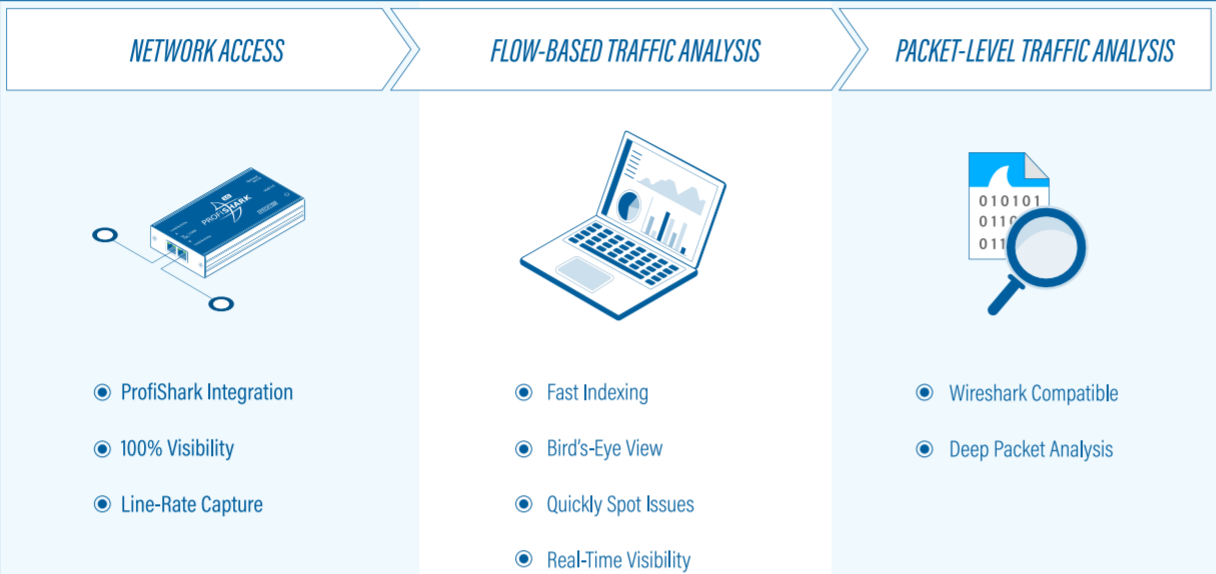
ProfiSight is a web-based network traffic monitoring application. Profitap can obtain capture data from ProfiShark, an FPGA-based hardware capture device, or can be used with a large number of separate file-based pcap/pcapng files to visualize the captured packets.
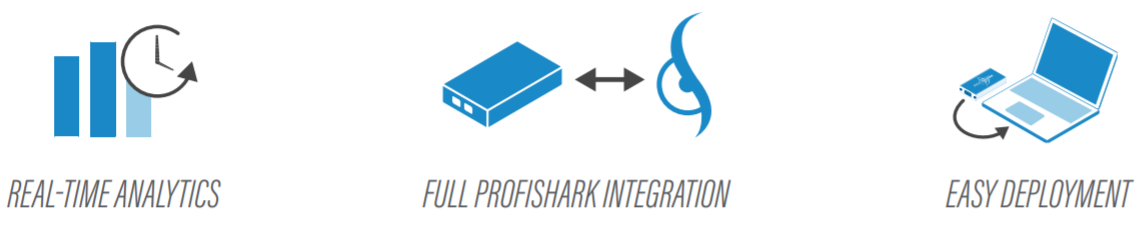
Captured packets can be indexed and optimized to instantly filter and visualize large network traffic to improve network workflows and reduce troubleshooting time.
ProfiSight's packet analysis function supports all 7 layers, and provides visualization templates for DNS, NETBIOS, NTP, FTP, SSH, SNMP, etc., allowing you to update reports while dynamically acquiring packets, and analyze large amounts of statically captured data.

→Datasheet ProfiSight-Datasheet (PDF)

Key Features
- Easy, fast, accurate problem detection
Instantly see inside your network traffic to find optimal performance, find and fix network issues.
・ProfiShark cooperation
It is integrated with the ProfiShark series, which is an FPGA-based hardware capture device, and allows you to perform capture operations, settings, and analysis consistently.
・Real-time analysis
You can quickly index captured packets to monitor your network in real time and reduce troubleshooting time.
- Customizable dashboards and panels
Create visualizations tailored to your needs using dashboards and panels that can be customized to suit your requirements.
- Fail-safe hardware speed analysis
Enables inline connectivity and fail-safe network analysis when used with ProfiShark.


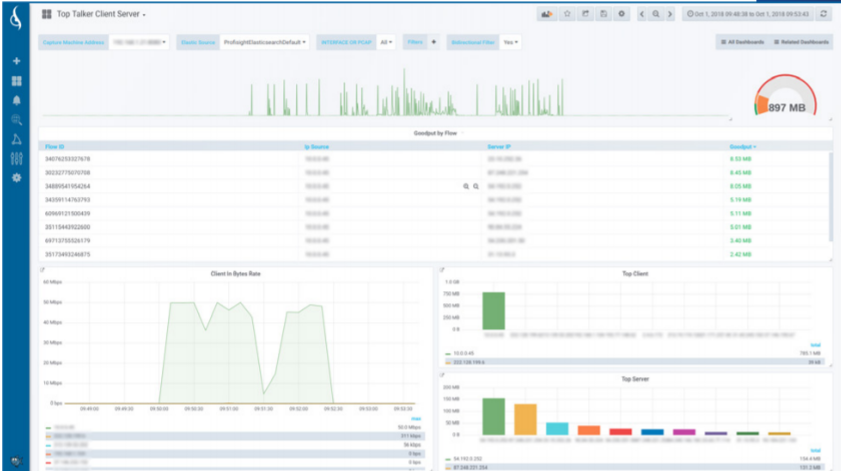
Example of Sight visualization screen

Application performance monitor screen
ApplicationPerformanceMonitoring
You can check the performance of each application by preparing an overview of all applications and a page for each application such as HTTP/SSL/DNS.

TCP troubleshooting screen
TCPTroubleshooting
You can pinpoint the root cause of TCP problems and visualize retransmissions, lost packets, server congestion, port usage, etc. on the TCP dashboard.

Latency detection screen
LatencyDetection
GeoIP allows you to check application delays for each server along with geographical information.

Bandwidth usage screen
BandwidthUsage
You can check the bandwidth by host, flow, port, etc. You can check microburst detection and traffic status in graphs.

Top N Screen
TopN
You can check the top list of network clients and servers by packet, bandwidth usage, and protocol in graphs and histograms.

Analyzer


System requirements

Datasheet IOTA-10G-Datasheet (PDF)

hardware

Minimum: Intel Core Duo 2.4 GHz, 8 GB RAM
Recommended: Intel Quad 3.0 GHz, 8+ GB RAM

Network

FastEthernet or later
(supports up to 10GBASE-X with ProfiShark10G)

Disk capacity

Installation 350 MB
Minimum 5 GB capture disk space
Larger disk capacity recommended for long-term capture

device

You can connect up to 6 ProfiSharks and use capture at the same time.

OS

Windows10 64biy
Linux(LTS) Ubuntu Family 64bit

price

Sales and support have ended. Please consider IOTA.
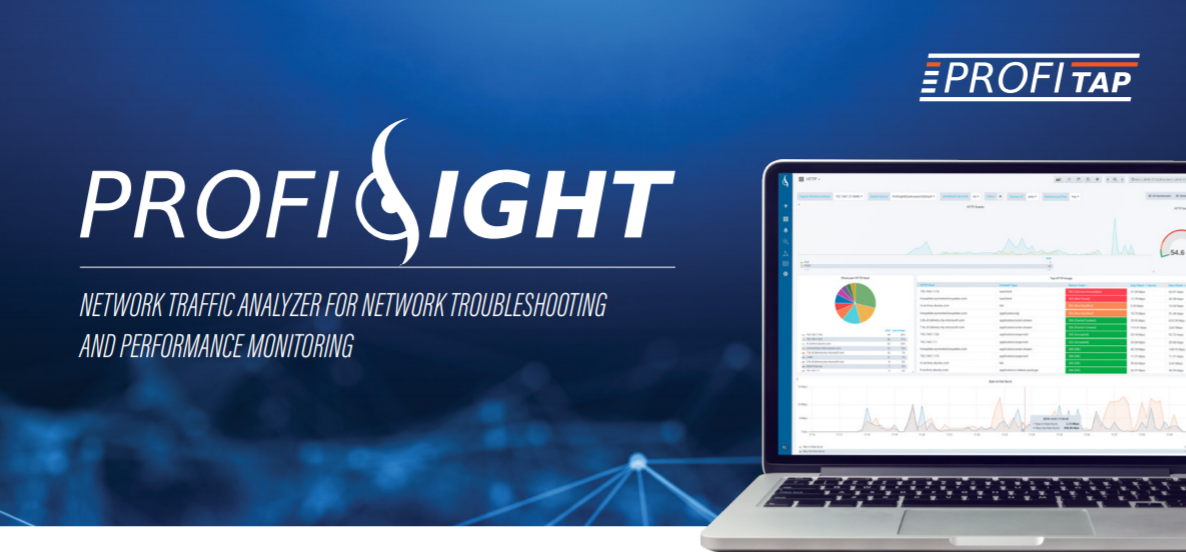