
|
|
+ Product list → CommView → TamoGraph → Wi-Spy → Chanalyzer → WLAN Pi → Nomad → MetageekApp → ProfiShark → IOTA → tap products → Dualcomm → penetration training equipment → password recovery → Side channel fault injection → Wireshark |
WiFi7 WiFi6EcompatibleWireless LANサイトサーベイtool
TamoGraph Pro Site Survey Ver8.3 登場
Price USD1999$ discount
WiFi7 IEEE 802.11be EHT mode
M.2 Intel BE200 / USB3 ASUS USB-BE92 and
TP-Link Archer TBE400UH WiFi7
WiFi6E IEEE 802.11ax in 6GHz compatible
Active + Passive Spectrum analysis Compatible with predictive survey
Spectrum analyzer
WiSpyLucid(2.4/5/6GHz)
compatible
Spectrum analysis of external waves for 1 minute before and after the measurement point is possible
TamoGraph Pro / Standard version 8.4(Build310)

TamoSoft's TamoGraphPro has been updated to version 8.4 Build 310.
This time, we have added support for the domestic Buffalo WI-U3-2900BE2 and Elecom WDC-BE28TU3-B
USB3 connection WiFi7 compatible measurement adapter. WiFi7 measurement becomes more familiar.
In addition, bug fixes and performance improvements have been implemented as new features such as requirement compliance display, AP list enhancements, and auto planner improvements
.
TamoGraph Pro / Standard version 8.3
TamoGraph Site Survey 8.3 (Build309) now supports ASUS USB-BE92
(not USB-BE92 Nano) that supports IEEE 802.11be
. There are more options than Intel BE200 and BE202 with built-in M.2.
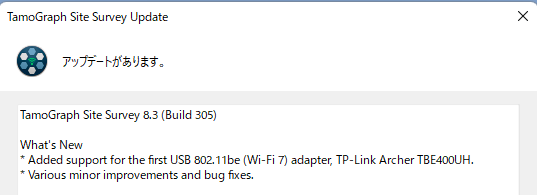
In addition to M.2 connection Intel BE200 adapter, USB3 connection external measurement adapter
Supports TP-Link Archer TBE400UH WiFi7 survey is possible
Other
compatible Wireless LAN adapter (TamoSoft Inc. website)
The highly popular wireless LAN site survey tool supports WiFi 7 6GHz IEEE 802.11ax
Company offices, outdoor farmland, urban areas, bridge and tunnel management (supervision work)
It is widely used in schools, factories, and government agencies under the Giga concept.
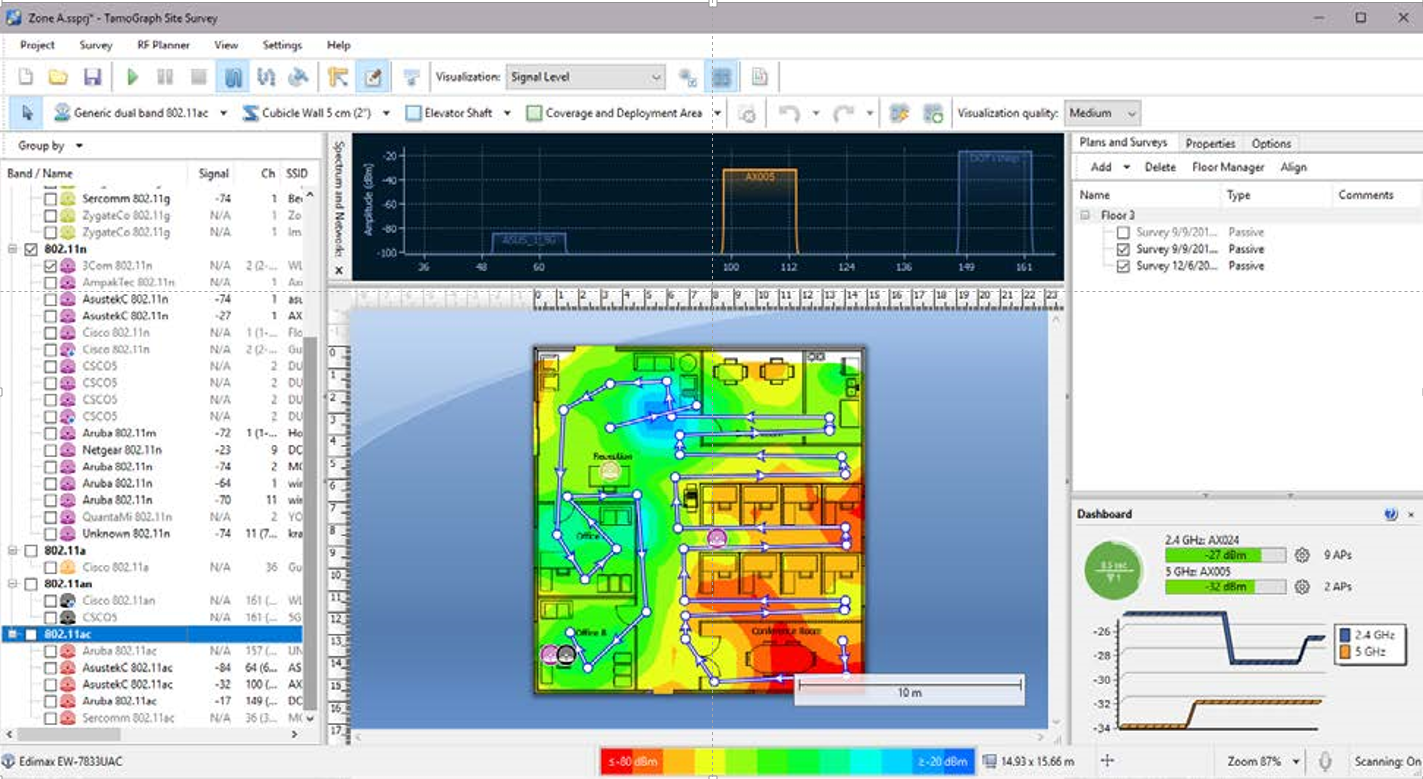
Create heat maps and coverage diagrams and use them for wireless design, construction, and troubleshooting
You can conduct a WiFi7 site survey with the USB3 connected external card TP-Link Archer TBE400U
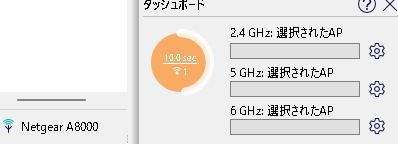
You can conduct a WiFi6E site survey with the USB3 connected NETGEAR A8000 and Alfa AWUS036AXML
Others
compatible Wireless LAN adapter (TamoSoft Inc. website)
OSCIUM's 2.4/5/6GHz Added support for compatible spectrum analyzer
Wi-Spy Lucid
Supports WiFi6E spectrum analysis. Visualizes external waves for one minute before and after.
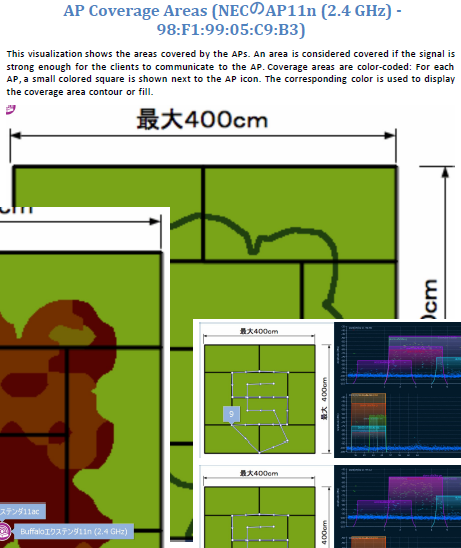
You can now visualize the second and third coverage diagrams.
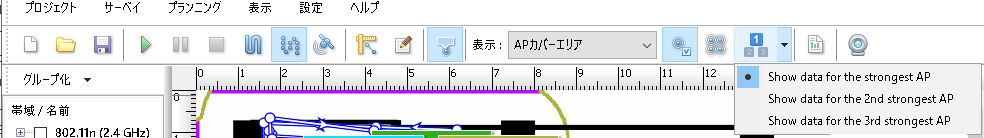
This allows you to create a coverage diagram that excludes very strong signals.
Also added support for GPU-based calculations.
(requires open CL1.2 or later and compatible graphics card)
And antenna properties and bug fixes have been made.
WiFi7 IEEE 802.11be WiFi6E WiFi6 IEEE 802.11ax compatible
Recommended points for TamoGraph Site Survey
Buy it all! There are no additional costs for 2 activations!
Even in InteropTokyo's harsh wireless LAN environment, you can perform passive surveys and spectrum analysis on your laptop
There is also a giga concept, and many installations are being made, even at construction sites for Sarakan (supervision) work! Actively working at an electrical installation shop
(Of course, active survey can also measure Ping and TCP/UDP up and down speeds)
We have many delivery records including Ricoh, Exiotec, IPA, etc.
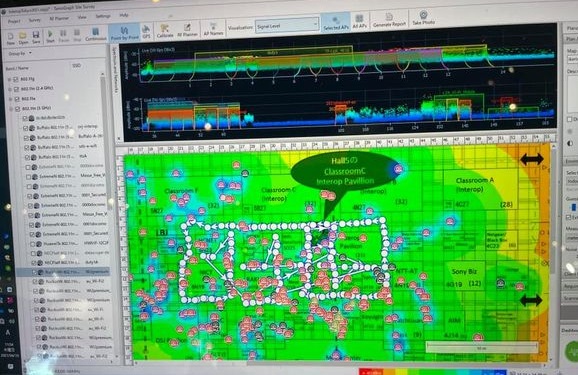
Heat map example at Interop Tokyo 2021 venue (Makuhari Messe)
For companies that find it difficult to implement Ekahau because it is too expensive.This is an inexpensive survey tool with similar functionality.
Compatible with active surveys, passive surveys, and predictive surveys
Coverage chart/heat map A tool that can create multiple reports and perform continuous mapping, etc.
Please give me
inquiry(→Online)
.
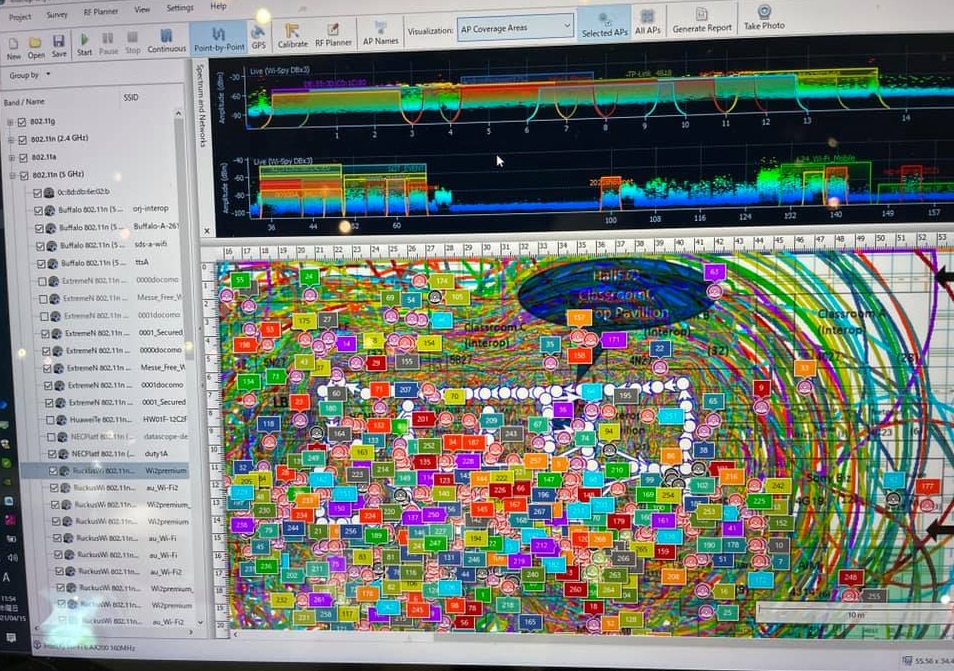
Example of coverage map at Interop Tokyo 2021 venue (of course, you can create a cover map focusing on individual APs and SSID roaming)
We also provide
wireless LAN site survey training for those who are new to site surveys so that they can conduct site surveys themselves. (WiFi7 WiFi6E compatible)
Our impression is that TamoGraph Pro is a very easy-to-use site survey tool.
TamoGraph Pro is conscious of Ekahau, and the screen is similar to Ekahau.
If you are using Ekahau, you can use it without any discomfort. The screen has also become more sophisticated.
We are an authorized distributor of TamoSoft →
TamoSoftInc.代理店ページ
Sample report →
パッシブサーベイ(PDF形式)
→
アクティブサーベイ(PDF形式)
→
予測サーベイ2.4GHz(PDF形式)
→
予測サーベイ5GHz(PDF形式)
→
スペクトラム分析report(PDF形式)
Product documentation
→
データシート(PDF形式)
→
specificationシート(PDF形式)
→
英文ヘルプ(PDF形式)
→
TamoGraphPro動画デモンストレーション@InteropTokyo2021(Youtube)
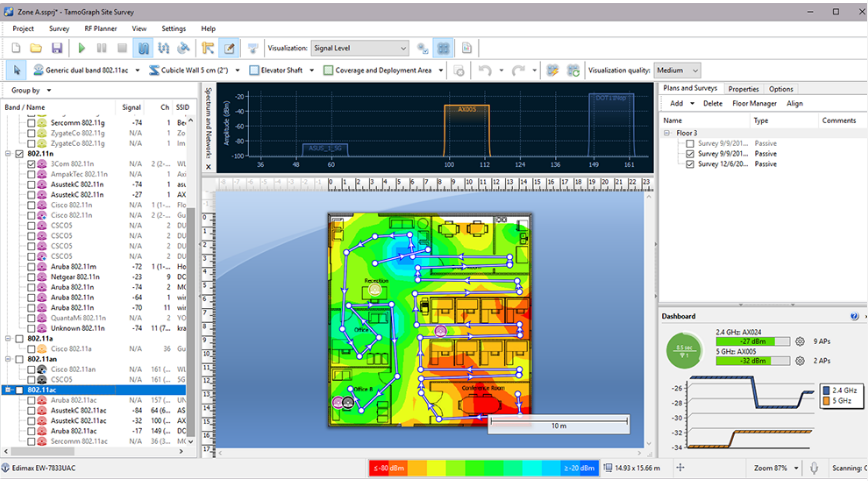
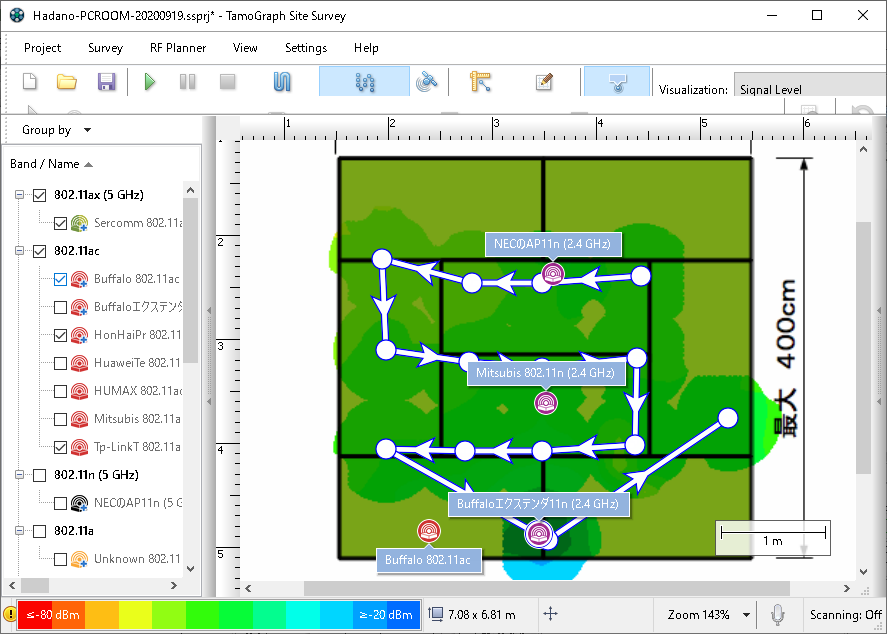
Example of creating a heat map and coverage diagram from passive survey + spectrum measurement
|
STEP1
Set the estimated radius and measure the wireless LAN points |
STEP2
Adjust the report for delivery (Japanese OK) |
STEP3
Create heatmap/coverage diagram etc. |
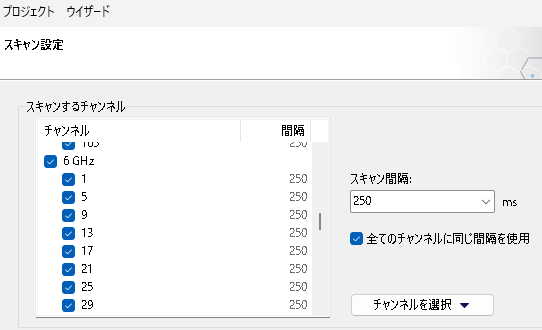
Passive surveys can be performed using point measurement (recommended), continuous measurement, or GPS (outdoors). You can specify the channel, band, etc. to be measured in advance. In addition, by linking with a spectrum analyzer, spectrum analysis can be performed at the same time. |
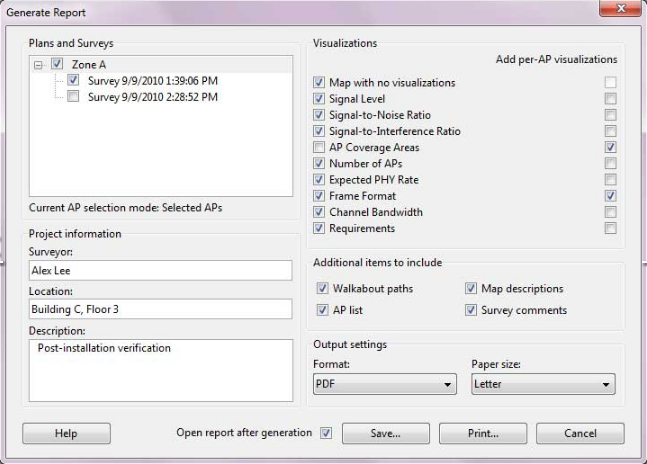
Before generating a report, you can select the AP or channel, edit the AP or SSID name (Japanese is available for clarity), and specify the report type, including coverage diagram, heatmap, and spectrum diagram. You can also edit the text of the generated report. |
|
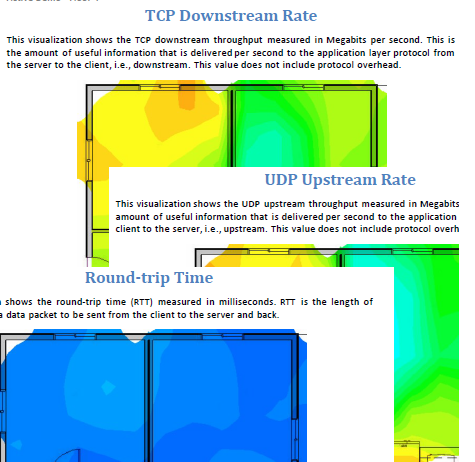
Example of creating ICMP round trip delay time diagram and
TCP/UDP upstream and downstream throughput diagram from active + passive survey
|
STEP1
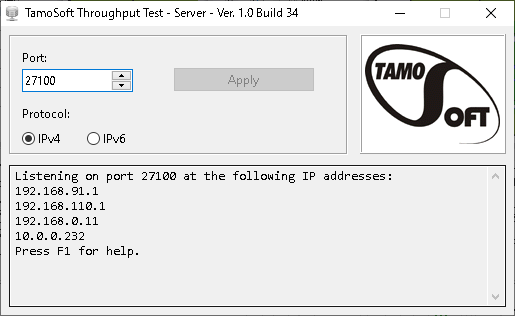
Connect to the relevant SSID and prepare the server |
STEP2
Conduct active + passive survey |
STEP3
Create uplink + downlink ICMP/TCP/UDP diagram |
|
|
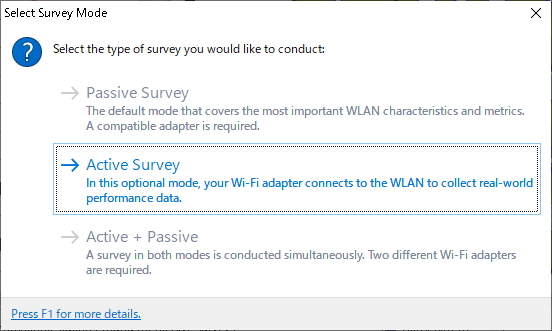
For active surveys, connect to the SSID using your PC's wireless LAN card. In addition, by using it in conjunction with a receiving wireless LAN card, you can conduct active and passive surveys at the same time. |
|
Main features of TamoSoft SiteSurvey
Main measurement methods
Passive survey (Reception only, target SSID/BSSID/channel can be narrowed down in advance)
Active survey (In addition to simple ping, up and down throughput measurement of TCP/UDP is also possible)
Spectrum analysis (Can be used with spectrum analyzer to create a spectrum analysis diagram for each location)
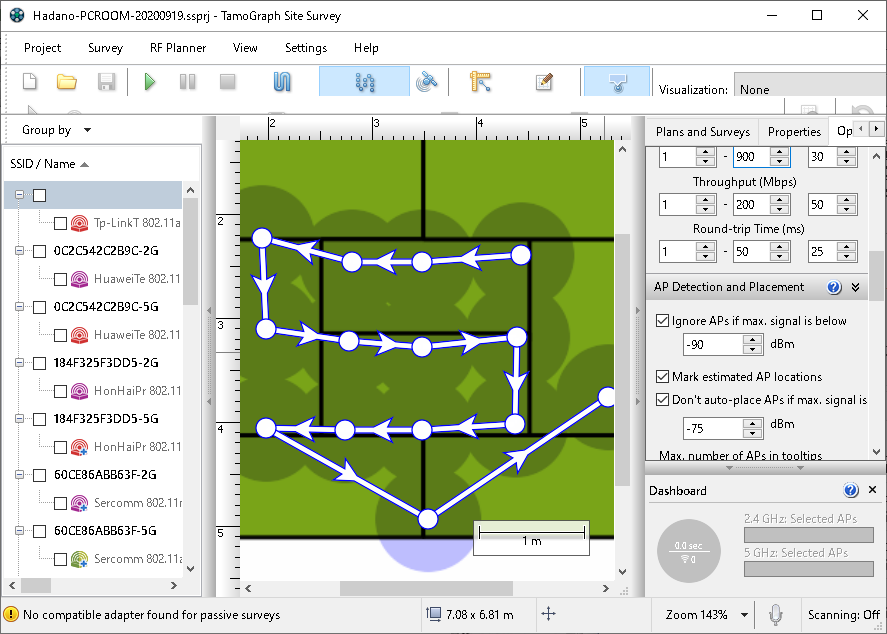
Predictive survey (RF Planner function allows you to create heat maps and coverage diagrams without inputting and measuring materials such as walls, partitions, roofs, etc. like in CAD software.

Predictive survey (RF planner menu screen)
Measurement data can be obtained accurately, and it consumes less memory than Ekahau, so it is lighter in operation.
Passive survey + spectrum analysis and passive survey + active survey are also possible
(Point measurement, continuous measurement, GPS compatible)
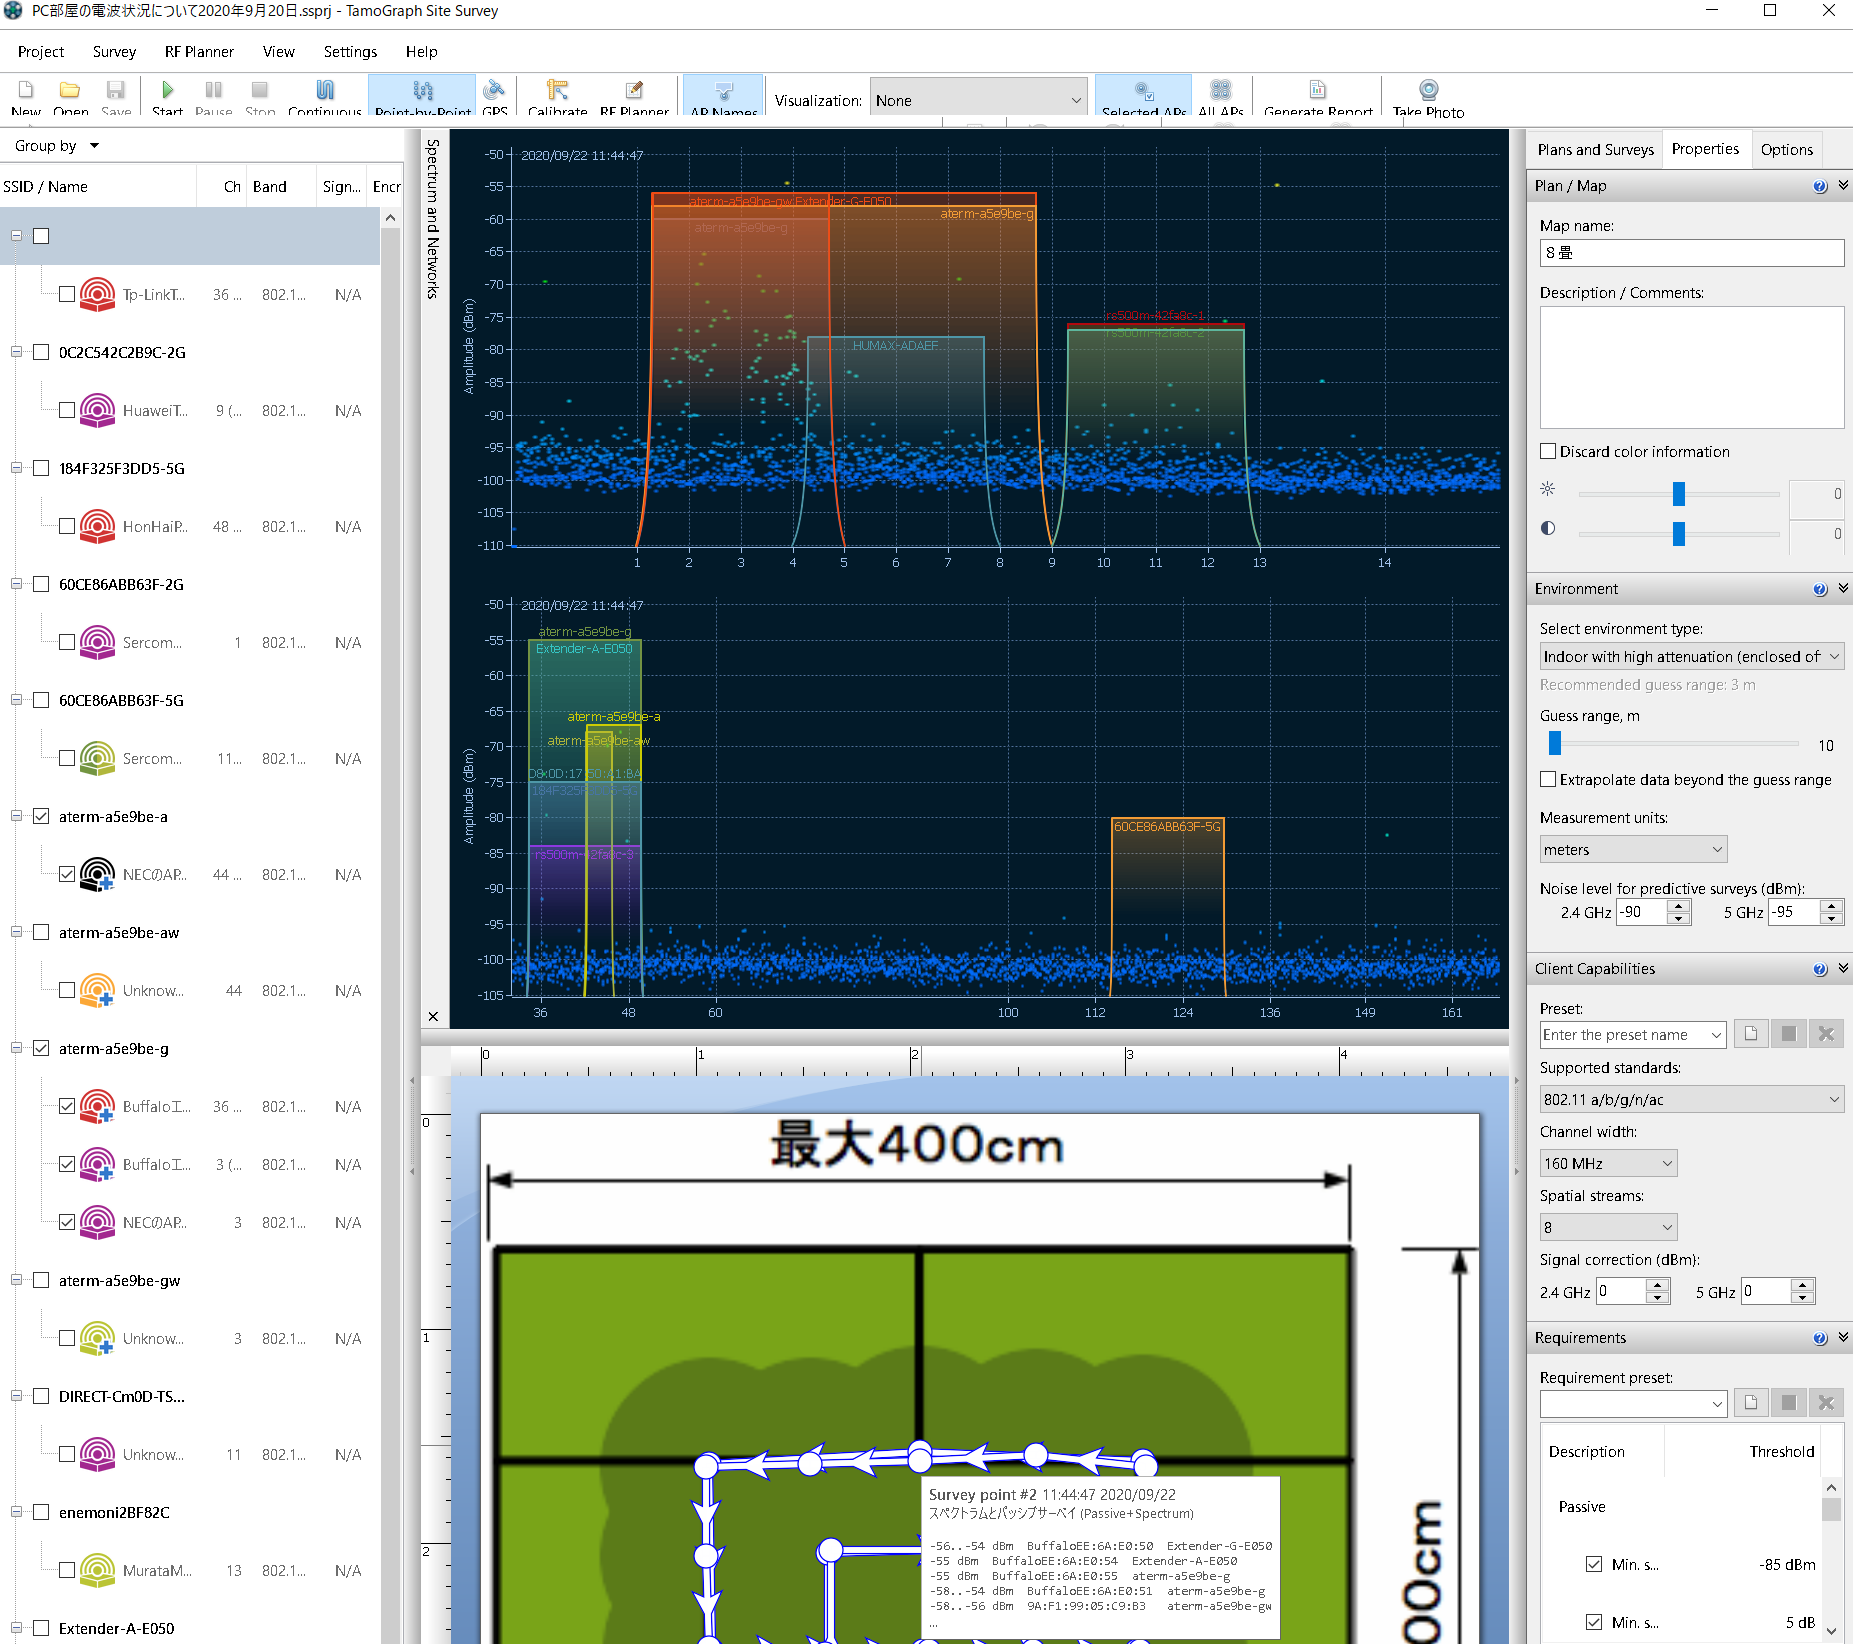
When performing spectrum analysis, you can obtain information from the spectrum analyzer for each measurement point and create a diagram.
In addition to general passive surveys and active surveys,
has a full-fledged predictive survey function and can create various reports.
Our company has a proven track record with electrical installation shops, design offices, carriers, etc.
And it's much cheaper than other companies' tools!
Please try using the trial version. →
米国TamoSoft
You can easily conduct wireless site surveys with TamoGraph Pro!
"It wasn't until I measured the floor that I realized that all the desks on the other side of the elevator shaft had no signal."
TamoGraph Pro not only measures the signal strength in all locations, but also automatically measures the throughput.
It is also compatible with spectrum analyzers, and signals and external waves measured with the
spectrum analyzer can be reflected on the map.
Main features
You can conduct passive surveys, active surveys,
full-scale predictive surveys, and create detailed reports with a similar operating feel as Ekahau.
You can import maps and drawings in various formats.
Supports passive scanning and active scanning with multiple wireless LAN cards.
Supports wide area measurement in combination with the recommended wireless LAN card.
Integrates spectrum analysis with Wi-Spy.
Simple and easy-to-use report generation screen
Reports generated with TamoGraphPro are useful as is, but they can be customized and modified in many ways.
In addition to heat maps and coverage diagrams, you can also generate throughput diagrams based on actual measurements.
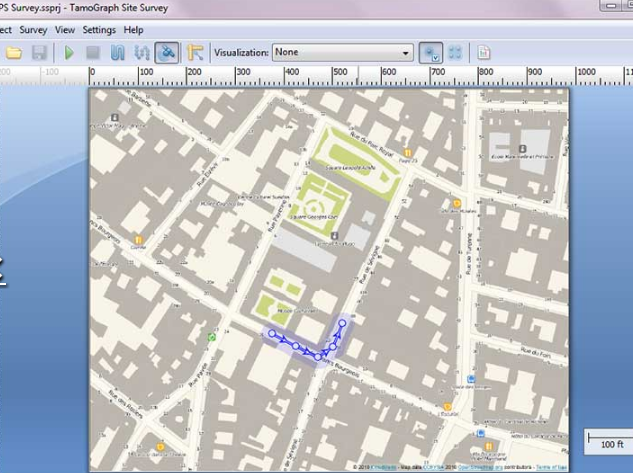
Outdoor survey example Compatible with Google Maps KMZ (Google Earth) format output possible
GPS linked Point measurement Supports continuous measurement etc.
Measurement with TamoGraphPro is fast and easy. GPS-linked point measurement
Supports continuous measurement, etc., making it easy to perform high-density measurements.
You can also perform virtual WiFi planning, which allows you to estimate
by temporarily installing an AP without actually measuring it.
→Please also check TamoSoft(米国公式) for details.
TamoSoft TamoGraph Pro SiteSurvey Pro operating requirements (Windows)
Windows 11, Windows 10, Windows Server 2022, Windows Server 2019 32-bit and 64-bit versions
Intel Core 2 or higher Intel i5 / i7 recommended 2 GB or more memory 60 MB or more disk space
Compatible spectrum analyzer
OSCIUMInc.WiSpy Lucid(2.4/5/6GHz)
OSCIUMInc.WiPryClarity(2.4/5/6GHz)
OSCIUMInc.WiPry2500x(2.4/5GHz)
Recommended Wireless LANアダプタ
Compatible with WiFi7 (IEEE 802.11be) Recommended wireless LAN adapter
M.2 connection IntelBE200 USB3 connection TP-Link Archer TBE400UH
Compatible with WiFi6E (IEEE 802.11ax in 6GHz) Recommended wireless LAN adapter
Intel AX210, NETGEAR A8000, Alfa AWUS036AXML
Other support
Wireless LANアダプタ(TamoSoftInc.サイト)
and NEMA protocol compatible GPS receiver
TamoSoft TamoGraph Pro SiteSurvey Pro operating requirements (macOS)
Sonoma, Ventura, Monterey, Big Sur, Catalina, Mojave
MacBook, MacBook Pro, or MacBook Air 2011 or later
4 GB RAM 60MB or more disk space
| Microsoft Windows | macOS | |
| compatible adapter | Use recommended WiFi adapter | MacBook built-in adapter |
| Installing the driver or packet capture engine | Install the capture adapter for TamoSoft's TamoGraph | Install packet capture engine |
| Simultaneous measurement of active and passive surveys | Can be supported by using two different adapters | No support |
| Using multiple adapters | Supports multiple adapters | No support |
Site survey tools require some getting used to and practice to install and operate.
If necessary, we also provide additional training and implementation support (separately charged).
Please feel free to contact us.
| type |
passive survey
*By preparing Wi-SpyDBx separately,
|
active survey | predictive modeling |
| (predictive survey) | |||
| When should it be done? | Highly recommended any time. The most comprehensive survey covering the most important WLAN characteristics and metrics. | option. Performed when measurement of the actual performance characteristics of a WLAN is required. | option. Perform pre-deployment to plan your WLAN and simulate its characteristics. |
| Hardware requirements | For Windows, a compatible wireless adapter is required. Please visit our website for the latest list of compatible adapters. No specific adapter is required on macOS. | Virtually any modern wireless adapter with the latest drivers provided by the adapter vendor will work with Windows. With macOS, no specific adapter is required and the application works with your MacBook's built-in adapter. | A high-speed multi-core CPU. Intel i7 is highly recommended. No wireless adapter required. |
| Additional software configuration requirements | none | You need to create a Windows profile for the WLAN you want to test. On macOS, the WLAN you want to test must be listed under Preferred Networks. | none |
| If you plan to measure TCP and/or UDP throughput, you must run the Throughput Server utility on the wired side of the WLAN. | |||
| How is your data collected? | The application passively listens for packets and does not attempt to connect to the WLAN. | Connect your Wi-Fi adapter to your favorite wireless network and measure the actual throughput rate and several other metrics. | No on-site data collection will be performed. Simulate data based on the created virtual environment. |
| Report diagrams that can be created |
Signal Level
(Signal level diagram) |
Actual PHY Rate
(actual PHY diagram) |
Same as passive survey |
|
Signal-to-Noise Ratio
(Signal Noise Diagram) |
TCP Upstream Rate
(TCP upstream effective speed diagram) |
||
|
Signal-to-Interference Ratio
(signal interference diagram) |
TCP Downstream Rate
(TCP downstream effective speed diagram) |
||
|
AP Coverage Areas
(AP coverage diagram) |
UDP Upstream Rate
(UDP upstream effective speed chart) |
||
|
Number of APs
(AP number diagram) |
UDP Downstream Rate
(UDP downstream effective speed chart) |
||
|
Expected PHY Rate
(PHY speed diagram) |
UDP Upstream Loss
(UDP upstream lost diagram) |
||
|
Frame Format
(Frame format diagram) |
UDP Downstream Loss
(UDP downstream lost diagram) |
||
|
Channel Bandwidth
(Channel Bandwidth Diagram) |
Round-trip Time
(round-trip delay time diagram) |
||
|
Associated AP
(corresponding AP diagram) |
|||
| AP list and its information list display | Possible | NG | Possible |
| Can I run surveys at the same time? | Windows allows simultaneous active + passive probing if your computer is equipped with two different Wi-Fi adapters. One of them must be compatible with passive surveys. | impossible | |
We are an authorized distributor of TamoSoft →
TamoSoftInc.代理店ページ
Sample report →
パッシブサーベイ(PDF形式)
→
アクティブサーベイ(PDF形式)
→
予測サーベイ2.4GHz(PDF形式)
→
予測サーベイ5GHz(PDF形式)
→
スペクトラム分析report(PDF形式)
Product documentation
→
データシート(PDF形式)
→
specificationシート(PDF形式)
→
英文ヘルプ(PDF形式)
→
TamoGraphPro動画デモンストレーション@InteropTokyo2021(Youtube)
TamoGraph Pro Site Survey Ver8.3 USD1999$ discount
WiFi7 IEEE 802.11be WiFi6E IEEE 802.11ax compatible
Measurement wireless LAN adapter + spectrum analyzer + NEMA compatible GPS
+ Separate proficiency training will be provided
Survey tools require wireless LAN knowledge and know-how.
We also provide training and wireless LAN site survey services at the time of installation
→inquiryください(SSL/TLS)


Copyright 1996-2010, ikeriri network service corporation, all rights reserved.